Introduction
Your company has recently made the jump to big data and now that a few months, or even years, have passed you think your team has a firm grip on getting data in/out of the environment for use, right? Most likely if you are thinking this you are probably also discovering that you aren't really sure how to easily hook one of your Business Intelligence (BI) tools to this data, against data you really want - i.e., a subset, and most produce fast and rapid-response results. These three simple tasks are almost universal to any BI request and can wreak havoc on teams in the big data age with so many services available but none providing a solution to any of these.
Oftentimes this will lead us elsewhere, purchasing expensive alternatives from third party companies to manipulate, display, and provide meaningful access to the data for our users and ourselves and in most cases what are we left with? The sad truth of it is that we're left with supporting multiple products or going back to what is familiar like SQL Server or other new in-memory alternatives such as Microsoft's Analysis Services Tabular models; neither of which we want to do.
In this article, we'll explore some of the various ways we can answer the question of how do we do BI from big data and compare alternatives with Jethro's approach. Most of the alternatives mentioned in this piece have been explored and even implemented (sad to admit) by me before big data really grew into what is available now. So please enjoy and feel free to provide input or email comments and share experiences with me and the rest of the Jethro team so we can potentially advise and help through similar situations and avoid the pitfalls described here.
Core Hadoop
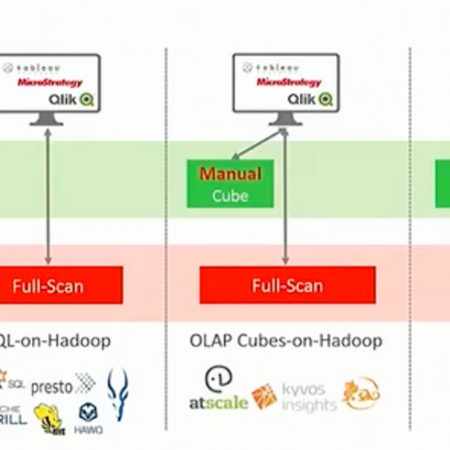
One of the most common, and frankly naïve, ways people approach BI with Hadoop, which generally ends in failure, is using core Hadoop to power BI reporting with tools such as Tableau, SSRS, or some other third party system like Business Objects, etc. When we talk about core Hadoop we are referring to the following services:
- HDFS
- MapReduce/MR2 YARN
- Hive/HiveServer 2
- Zookeeper
Now don't get me wrong, MR2/YARN and the others listed above are excellent for what they are meant to do, but one of these services is often misrepresented for being a multipurpose solution that it is not: HIVE. The purpose of HIVE is simple, batch processing in/out - that's it. Working with a company a few years back there weren't many alternatives and I remember seeing demos with HIVE tables and views as the source to a Tableau dashboard. At the time, we were looking for alternatives to present the data quicker from HIVE into Tableau and ultimately ended up settling on SQL Server Analysis Services Tabular (more to come on this). I can clearly remember asking the presenter to manipulate filters via screen share and then the awkward waiting as one, two, five minutes passed as we waited for a MapReduce job to run in the background unbeknownst to the audience for the new data.
One of the major problems with this solution is the fact that Tableau, and other tools that rely on queries to refresh data, will cause MapReduce jobs to be launched as users explore and elect to change the initial set of data. There are clever ways around this, extracting the data all up front, etc., but oftentimes the cost for doing so is not worth it.
For example, take the connection below to a table with ~75M rows:

Connecting Tableau to Hive + Spark*
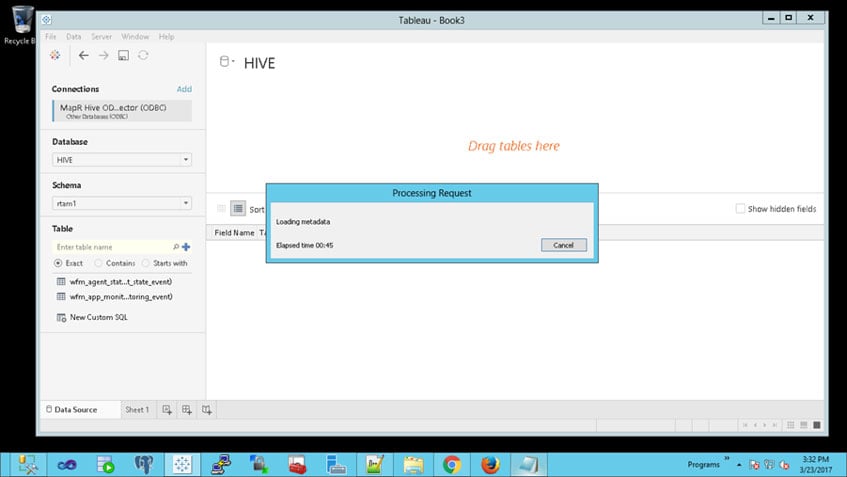
The screenshot illustrates how long the wait was for metadata generation (I killed it after 2:00 minutes). One could argue that limiting the general import would fix this issue, i.e., if I did a LIMIT 500,000 I can pull the data through, and that is true. But what do you do when your smallest dataset initially starts at 25M, 50M, or greater?
You can spend many man hours on attempting to make this work with partitions, shrinking data into smaller tables, or other downstream tasks but none will ever prove sustainable nor provide the speed many of your customers are expecting.
Retro Solutioning
Retro Solutioning, which may be a coined term (not sure to be honest), is when you don't know enough about the other Hadoop services outside of the core features and decide to stick with what's "safe." The resulting solution will utilize technologies your team has at hand and is comfortable with and is usually the second line of attack when initial plans don't quite work out (see the previous section).
Although there are valid situations that may call for utilizing existing technology and every company and situation is unique, more often than not it proves to be additional work and, by nature, additional processes for you to manage. Not only does this completely negate the purpose of Hadoop and big data but it wastes the time and resources of your team and has a high likelihood of becoming a band-aide solution instead of a scalable one.
Being a Microsoft SQL developer for 10+ years prior to getting into big data I felt this example, derived from my own experience, was very relevant to this topic and involves utilizing Microsoft SQL Server and the Tabular Analysis Services features to make up for less than desired performance out of Hive. We'll start by outlining the hypothetical project and then go into the implemented solution and the results afterwards. As you read through it, think of how you'd approach this problem and if it lines up or not (if it doesn't line up then you may have did it right!)
The "Hypothetical" Project
Project: Reporting Dashboards
Original Systems:
Microsoft SQL Server (DB)
Microsoft .Net for dashboards - yikes, I know
Microsoft Reporting Services
Project Overview:
Take existing reports that have an MS SQL Server database source and upgrade them to Tableau, deprecating any use of .NET as a dashboarding interface and removing any reporting dependency on MS Reporting Services.
Project Requirements:
- All reports should load in <10 seconds on initial browse
- All reports should respond to filter changes within <10 seconds
- Data source should hold at least 1 year for users to pull in active reports/dashboards
- Solution should be able to handle a user Base = 1000 users with 200 being concurrent
The total data size is 225 million rows
Seems straightforward enough, right? The answer: Maybe.
Knowing that plugging your reporting tool, Tableau in for this case, into HS2 is a no-no for BI when a performance SLA is involved, we needed to come up with a way to solve for this quickly. Since we had SSAS talent and owned pretty beefy machines we decided to aggregate where possible and push to memory using the in-memory Tabular SSAS. Acknowledging that there would be overhead to develop the exports of data from Hive using ODBC and SQL Linked Servers and there would be duplication of data between what was stored in HDFS and Tabular we set off on our journey. The first thing that hurt us the most was the time it took extracting data from Hive into the in-memory area for SSAS and we were hit with the almost same overhead if we were to have just connected Tableau directly to HS2.
Here is a breakdown of the different systems via SQL Linked Server and ODBC. Note: Impala nor Jethro were available to us at the time b/c we didn't even consider exploring them!
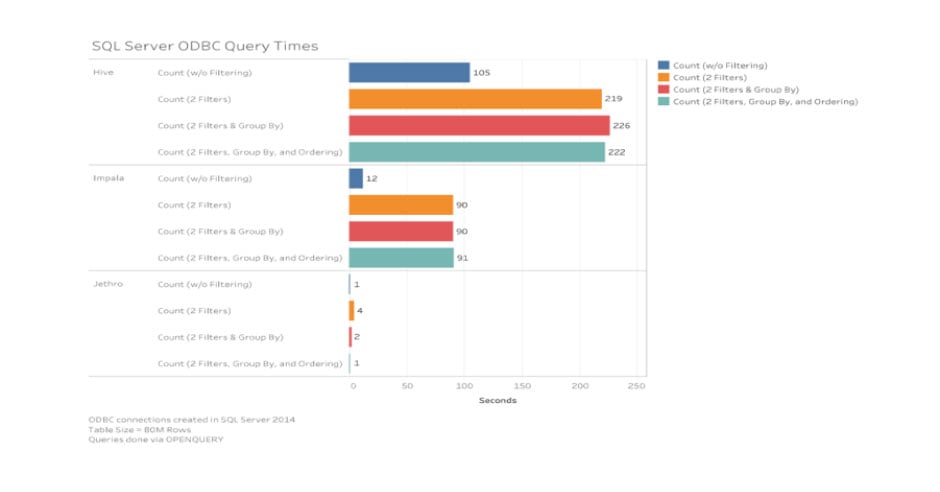
A couple things to note from the above; 1. The query times are using OPENQUERY to import data into SSAS, 2. Each resulting set was against an 80M row fact table unrelated to the one from our hypothetical project and the testing scenario used a query that would generate a dimension with ~1200 rows, and 3. Hive is Hive + Spark which definitely helped improve timing after a container was created.
So, with the time trials in mind, let's get back to the hypothetical project and import. The next screenshot (below) shows an import of 1 day for ~7.1M rows and although the time is not show it took approximately 20 mins for this entire import. If you do the math it would take, in theory, 632 minutes for the entire dataset (10 hours)
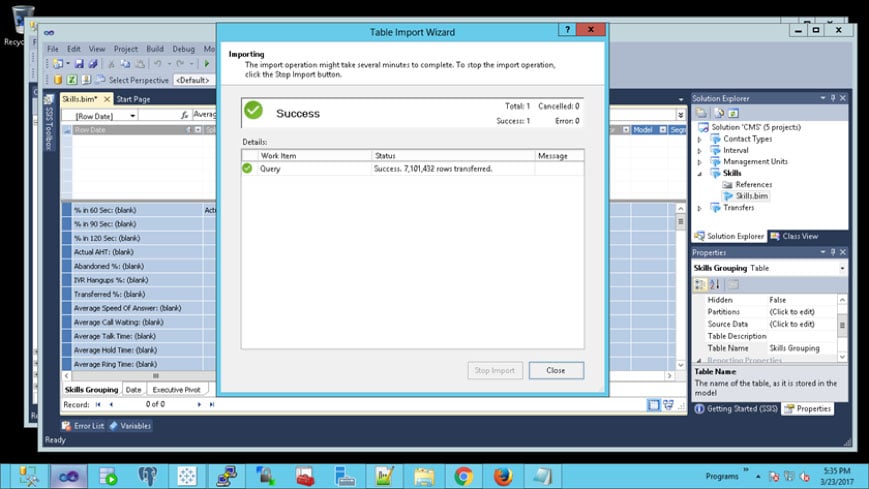
Importing the data at an aggregate level for our reporting did help, knocking the row counts down to about half the total, but that is well beyond the recommended size for in-memory solutions for Tabular Analysis Services and this showed when we hit it with Tableau. Query filtering was at best 10 seconds and could sometimes hit upwards of 30/60 seconds depending on if we were cascading filter boxes or not. We quickly learned that if we were seeing this type of performance during development and while hitting these reports on Tableau Server that it was not going to work for our customers and be a nightmare as we scaled up in size and userbase.
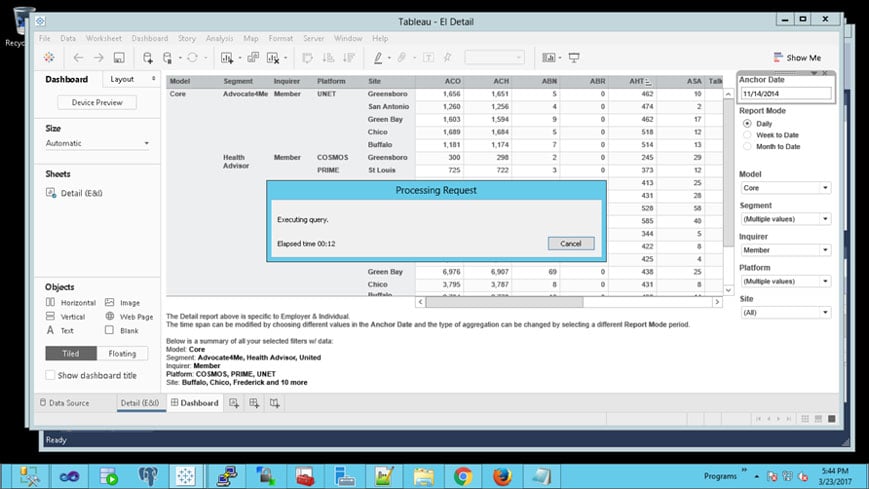
Below shows the wait on-open of the dashboard with Tableau Desktop. This would easily be prolonged when opening from the server and busts one of the requirements for SLA.
The Pitfalls
We learned how to connect different systems to HS2; but we also learned that relying on it to feed a performance driven solution was not going to work without doing one of the following:
- More hardware - faster and more expensive SSAS machines would certainly help - but where is the budget for that?
- Compromise on the solution. Reduce the amount of data kept and displayed assuming the customer would allow that - probably not
After reading this you may be saying "well, there are many other solutions like Cognos, SAS, AtScale, that can use as a layer to prepare data for BI" and that is certainly true. However, in my humble opinion, those solutions are not retro since most companies have not had them in-house for years like your SQL Servers or Oracle databases (MS Access - don't even go there). The point of this section wasn't to bash older database technologies or discourage you from pulling data into them if that works for your customers' needs; but rather to illustrate how they may solve for the short term but fail in the long run when we include the other aspects of what makes data "big."
The Best of Both Worlds
How do we get the best of both worlds? That is the question of the day, what magical solution will allow us to get the benefits of Hadoop and power your BI while, at the same time, avoiding costly add-on tools that mimic some familiar functionality. Sticking with your current BI tool, whether that is Tableau or Qlik is the right start but you also need to identify what your overall direction is with BI and reporting within your organization. Oftentimes we jump into tools that have punch lines such as "bring Hadoop to your analysts" or "data discovery at your fingertips" and while these tools may be great at specific tasks, they ultimately fall short with BI.
Keeping in mind there may never be a "catch-all" solution, and why would there be - this is Hadoop and it's an ecosystem, let's break it down by some BI needs…
Power User Pandemonium
A situation derived from personal experiences, having an abnormal amount of power users who have decent-to-good skills in SQL and databases and who really just want to get the data and manipulate it for their own reports. This BI nightmare, or dream depending on how you look at it, often includes many ad-hoc queries tapping your source system and the use of easily accessible analyst tools like Microsoft Excel and Access to pull data in and do what is needed with it.
Report Stores
Having a bunch of reports that are maintained by a development team and utilized by analysts but are relatively trivial when inspected independently. We all have instances of this, these "quick-hit" reports that were spun up to answer 20-30 users constant inquiries and they never went away.
Dashboards
The traditional dashboard requests that serve to answer many questions from executive levels and onward (depending on your organization). Dashboard development is the best part of BI, in my opinion, because it encompasses all the challenges associate with BI (learning the business, data, and dashboarding tool use).
What's the Answer?
Easy…There isn't one answer to handle it all as I eluded to in the previous sections. But if you approach your BI challenges knowing that you are starting down the right path because you are coming in with an open mind to the different technologies and combinations of them that will help you when solutioning. For example, one of my favorite approaches to solving the BI needs we listed above (realizing there are more than those three) is using this stack:
- Core Hadoop
Hive + Spark for batch processes and heavy lifting with HDFS, YARN, Zookeeper
- Impala
Deployed to adhoc users and analysts who know their way around various SQL languages and won't have the patience, or need, for Hive. Impala is a big win for organizations jumping into Hadoop that have a lot of power user’s b/c it provides a happy medium between big data and what they're [your advanced users] are used to working with.
- Jethro
This is my SLA-saver. Impala works great and can be used for a lot of quick reports or outputs that a few users rely on but it can easily fall short when it comes to speed and tight SLAs. If you are presented with a strict SLA such as reports respond in <10 seconds or filters need to be near-instance on change -Jethro is the answer. With access to HDFS and the usage of the new manager tool (Jethro 3.0), data can easily be imported and queried with many of the common BI tools; Basically, any tool that can make ODBC connections can utilize the data within Jethro making it very powerful.
- Hue
Replaces a lot of user's need for some tool similar to Microsoft's SQL Management Studio and visualizes the abilities of Hadoop. I find Hue is a great way to help new users to the Hadoop world understand the basic principles of it while still getting their data, i.e., they can browse HDFS, use the import table wizard, etc.
- Sentry
Provides role level security for your stack for Hive, Impala, and Jethro. This is a must when you are going to have advanced users playing around via Impala because it shares the Hive metastore and you'll want to restrict your users so they don't accidently drop or start creating duplicate items.
The above listing, although high level, is an example of my favorite stack setup that has proven successful for solving big data and BI needs because it is focused on ensuring there is a service for every type of scenario while avoiding getting backed into a technology corner per-se.
Related: Read our white paper on making interactive BI work on Big Data
Having worked as a database architect for 10+ years, beginning with Microsoft SQL Server 2000+, Analysis Services, and ultimately Big Data Hadoop, AJ Adams has come across many different challenges. He has worked with many different types of organizations covering a variety of industries including energy, government, healthcare, and sales/marketing; designing and implementing architecture for BI-related solutions using tools such as Tableau, Qlik, and others. With the growth of the size of data he moved into Hadoop, primarily Cloudera and services associated with the distribution specializing in administration, development, and overall stack setup. He believes one of the keys to success with making the move to big data is to approach it openly and focus on what sets of services can best handle the various needs versus battling to come up with a 'one-solution-fits-all' design.