Share
It's no secret that traditional big data stored in Hadoop clusters, and processed by Hadoop’s original Map/Reduce engine, can have very high latency. To solve this problem and enable faster access to the data, new SQL-on-Hadoop solutions have emerged, which provide improved performance. These include Cloudera Impala, Spark, Presto, Drill and Jethro. The promise of Impala and similar tools was to enable interactive data exploration, instead of having to wait long periods of time for the data in Tableau to refresh, or being forced to extract only a small part of the data and work on that sample.
While Impala represents a big performance gain compared to traditional Hadoop, if your data set is over 1 billion rows, data visualizations will still not be fully interactive. Later in this article we’ll show some numbers, and suggest a solution for the problem.
Connecting Tableau to Impala
Here are the general steps for adding Cloudera Impala to Tableau as an additional data source:
- Download and install the Cloudera ODBC driver for Tableau.
- If you don’t already have Impala running with real data, you can run the Cloudera QuickStart VM, which contains Impala and a working Hadoop cluster with one node:
- Run the VM using VMware Player.
- Go through the installation process, selecting Impala Editor when asked which application examples to install.
- Load an example data set such as the Tableau Superstore data set. You will need to save it as a tab delimited CSV to work with Impala.
- Test that the data set is working in Impala.
- In Tableau, connect to a data source, specifying the IP of your Cloudera Virtual Machine as the server.
- Drag fields to the workbook, and start building visualizations with the Superstore data, pulled from Impala.
For full details, see the step by step blog post by Albatrosa.
Is it Really Real-Time?
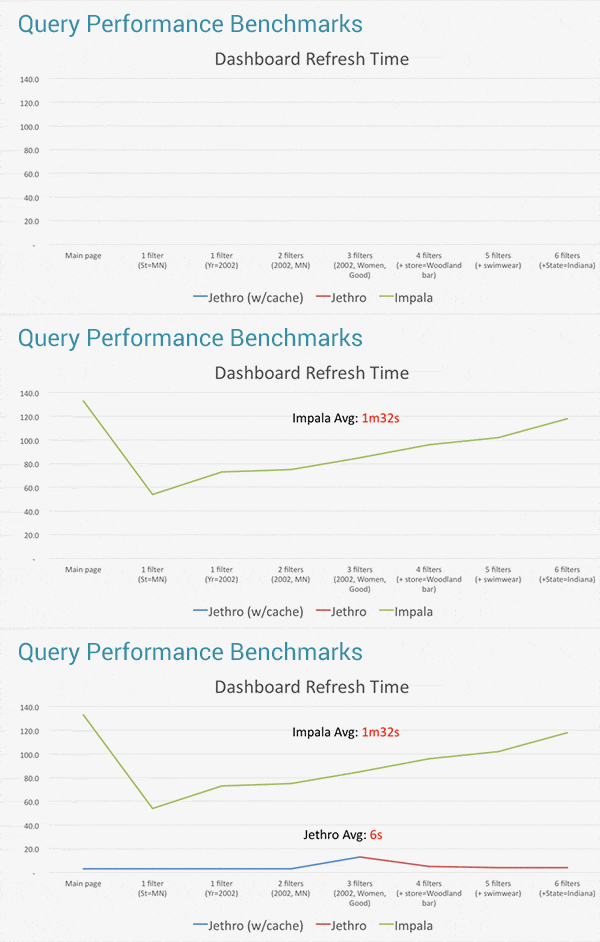
It is widely thought that Impala provides real-time performance on Tableau. We wanted to test if this was true with large datasets of over a billion rows. So we ran a performance test based on the widely accepted TPC-DS benchmark to see if this was true. We used a massive dataset of ~2.9 billion rows, testing what happens when you add successively more filters to your Tableau visualization.

What we saw was that Impala gets slower and slower the more filters you add to your view on Tableau. On average, even with only ~3 filters applied, Impala took over 1:30 minutes to refresh the view. Because this refresh rate does not allow true exploration, slicing and dicing of the data within Tableau, many users resort to working on a subset of extracted data, instead of the full Impala data set.This provides much faster refreshes, but it places significant limits on data analysis because they are not working on the full data set.
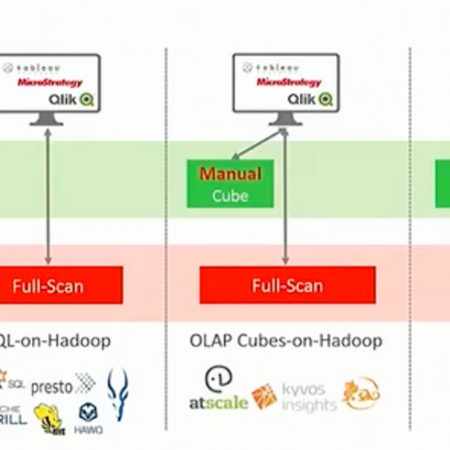
The reason for this performance challenge is that Impala is based on an MPP (Massively Parallel Processing) architecture which performs a “full scan” of the entire Hadoop dataset for an answer to a user query . The more filters are applied by the user, the more additional full scans are needed to assemble the relevant data to answer the query, and the longer it will take to resresh views in Tableau.
Immediate Query Processing on Big Data with Jethro
An index-access architecture is the most flexible solution for directly querying your big data source directly from Tableau. Cloudera Impala and other engines rely on MPP (massively parallel processing database) architectures that fully-scan the entire database with every query. By contrast, drill-down, index-access architecture removes the need for limiting extracts or cubes and allows you to query your data and drill-down any way you’d like, at interactive speed.
Jethro is an index-access SQL acceleration engine that was built for the unique scenario of flexible user queries on large data sets. Instead of fully scanning the data (MPP), like Impala and all other SQL on Hadoop tools, Jethro indexes every single column of the dataset on Hadoop HDFS.
Jethro leverages these indexes to surgically access only the data necessary for a query instead of waiting for a full scan, resulting in query response times that are faster by an order of magnitude. This enables a true interactive response to queries and speed-of-thought exploration of data on Tableau. Queries can leverage multiple indexes for better performance - the more a user drills down, the faster the query runs.
In the above benchmark, while Impala and RedShift took over 1.5 minutes to refresh the Tableau dashboard, Jethro took only 6 seconds on average. This enables truly interactive data exploration on Tableau, even for very large data sets and with constantly changing user queries.


